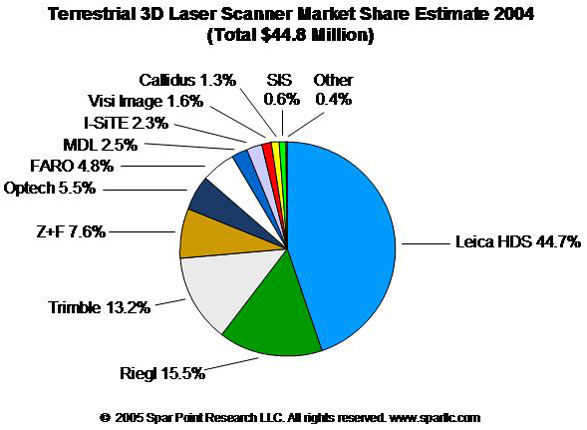
Sales of terrestrial 3D laser scanners topped $44.8 million in 2004, according to our latest estimate – a growth of 65% over the year before.
Participants in the terrestrial 3D laser scanner market include:
- Leica Geosystems HDS, LLC
- RIEGL Laser Measurement Systems GmbH
- Trimble Navigation Limited
- Zoller+Fröhlich GmbH
- Optech Incorporated
- FARO Technologies Inc.
- MDL (Measurement Devices Ltd.)
- I-SiTE Pty Ltd
- Visi Image, Inc.
- CALLIDUS Precision Systems GmbH
- SIS, Inc.
By our current forecast, terrestrial 3D laser scanner revenues will exceed $65.9 million in 2005, up 46% over last year. We see no sign of slackening demand – the modestly lower growth this year is largely due to extraordinarily high growth last year driven by major new-product releases. The 3D laser scanner industry is a capital equipment business with product release cycles often longer than one year, which can result in irregular growth year-over-year.
As with the overall terrestrial laser scanning market [hardware, software and services – see 3D Laser Scanning Market Red Hot], all indicators are that strong growth in hardware sales will continue for the foreseeable future. Practitioners and vendors agree the market has moved from early adopters to the beginnings of mainstream acceptance, driven by spreading recognition of how improved dimensional control aids design, fabrication, construction, operations and maintenance. Further spurring growth, we believe, will be new hardware and software technologies now in development – we see no signs of softening in the industry’s R&D investments.
Methodology
Sources – In developing market estimates, Spar Point’s practice is to seek guidance from executives at the subject companies. However, most of the companies named herein are privately held and thus have no obligation to report revenue or other business information. Three of the companies were publicly traded when these estimates were developed; however, of these only Leica Geosystems reported revenue for its 3D laser scanning business in any detail. [Leica Geosystems was subsequently acquired by Hexagon AG.] We have made some effort to validate our estimates with customers, partners and other independent sources, but in most cases the data is difficult or impossible to verify.
Basis – These figures represent 3D laser scanner hardware revenue only. Our intent is to exclude software, services and other collateral revenue.
Revenue vs. user spending – Market totals represent the sum of vendor revenue, not user spending. The market total is inflated compared with user spending because it includes intra-industry OEM sales by Z+F to Leica Geosystems HDS, but deflated compared with user spending because it excludes dealer markups due to equipment resale.
Caveats
Growth fluctuations – The 3D laser scanner industry is a capital equipment business whose product release cycles are often longer than one year. This can result in irregular growth year-over-year.
Disclaimer – This information is based on the most reliable data obtainable by Spar Point at the time of publication. However, the information is furnished on the express understanding that unless otherwise indicated, it has not been independently verified and may contain material errors. Readers are cautioned not to rely on the information in forming judgments about a company or its products, or in making purchase decisions. The information is not intended for use in the investor market, defined as an individual/entity whose principal use of the information is for the purpose of making investment decisions in the securities of companies covered directly or indirectly by the information. In the event of error, Spar Point’s sole responsibility shall be to correct such error in succeeding editions of this publication. Before using the information please contact Spar Point to ensure it is the most recent version.
This information is excerpted from Spar Point’s publication Capturing Existing Conditions with Terrestrial Laser Scanning: A Report on Opportunities, Challenges and Best Practices for Owners, Operators, Engineering/Construction Contractors and Surveyors of Built Assets and Civil Infrastructure. More information including hardware market-share forecasts for 2005, hardware/software/service breakdowns, vendor profiles and cost justification is available by subscribing to this publication. To subscribe or learn more, click the link above or contact Tom Greaves at email [email protected] or tel. 978.774.1102. geovisit();


